
First published June, 2019. All figures open separately by clicking on the header or caption.
The largest school district in America with an elected school board, LAUSD (the “District”) is vast indeed. It is hard to get one’s head around how big. And it’s hard to understand what’s involved, never mind ubiquitously presumed, when outcome or performance metrics such as “excellence” or poverty or enrollment drain are casually discussed.
The District publishes interesting “fingertip facts” every year that attests at 710 square miles, it covers an area 41% greater than the City of Los Angeles (CoLA). Eighteen cities are partially covered by its footprint and 8 lie entirely within the District.
What Schools?
Just the simple number of schools within its footprint is astonishing. The whole conversation surrounding “traditional district” and charter schools of either variety – “affiliated” and “independent” – begs the question of the system’s diversity, not just in the student population but in the kinds of schools operated. Beyond K-12 elementary, middle and high schools, operating as charters and “Alternative Schools of Choice” (e.g., magnet schools among others), are Special Education programs, Adult and Trade/Tech programs, and four kinds of schools that address specialized scholastic needs such as education for the incarcerated or otherwise academically at-risk.
Diversity of LAUSD-area school types
dist-of-school-types-by-magnet-and-district-status
What Authorizers?
The one thousand+ schools listed here for 2018-19 include some public schools operating within LAUSD’s footprint, that are not also under their direct jurisdiction. There are schools operated by and also chartered by Los Angeles County, and there are schools chartered by the State of California as well.
Authorization and management of school types
School-types-in-LAUSD-territoryThe extended list is a challenge to compile accurately and completely because schools are catalogued by Local Educational Agency (LEA) not geography. All data were downloaded May, 2019 from the California Department of Education and lausd.net, but categorizations and isolation or transfer of data between agencies and datasets makes for slightly different composition of the areas of interest. The groupings used here are not officially sanctioned. For example, schools chartered by State and County are not typically included in considerations of LAUSD enrollment, but these adjacent cousins do constitute a colloquial “educational climate” when considering “LAUSD”. Both agencies oversee charter schools operating as tiny isolated “Districts” of their own, financially ‘independent’ of the chartering agency. This financial management status is one of the distinguishing features of charter schools. “Affiliated” charters are fiscally dependent on their chartering agency (here, LAUSD). “Independent” charters operate as their very own quasi-distinct District, inefficiently replicating many of the functions performed by the very LEA that charters them: financial, reporting, administrative.
What Districts?
The distribution of schools between LAUSD’s seven Board Districts (BD) is uneven. The politically gerrymandered “Board Districts” (BD) reflect a different construct from the District’s more functional “geographic” or “Local Districts” (LD). Because policy is set by the politically elected school board the demographics explored here are (from 2018-19) according to Board District.
GEOGRAPHIC divisions (LD) of LAUSD
LAUSD-by-geographic-districtELECTED BOARD divisions (BD) of LAUSD
All-LAUSD-BoardDistrictsBD2 encompassing LA’s eastside, has nearly twice as many schools overall as the smallest BD4 encompassing LA’s westside and Hollywood. More adult and trade schools are located within BD2 by far. The preponderance (N=965) of schools are “Regular” or “Alternative” K‑12 facilities operated by the District or as a charter. More than twice as many of these are District as charter schools; charters constitute nearly 30% of the entirety of “public” schools operating inside LAUSD’s footprint.
The disparity in a district’s relative proportion of charter schools compared with the relative percentage of enrollment indicates that charters in BD1 (West/South-Central) and BD2 (East LA) are relatively less well enrolled; in BD3 (West Valley) they are the opposite – particularly well-enrolled. This reflects the high proportion of affiliated charters in BD3, incentivized by former Broad Academy-trained Superintendent Deasy to convert its many popular, diverse District schools to charter status by specifically restricting federal Title I (poverty) funds from these Title I schools of middling diversity.
Distribution of ENROLLMENT by Board District
enrollment-among-school-types-by-magnet-and-district-status-with-percentageThe type of charter school, affiliated vs. independent, is not evenly spread between districts. Affiliated charters do not exist in BD2 (East LA), BD5 (NE/SE LA) and BD7 (Central/South), the three most populous Districts (also see charts following). The affiliated charters in BD6 (East Valley) and BD1 (West/South-Central) are an order of magnitude fewer than in BD3 (West Valley) and BD4 (West/Hollywood-SM Mtns). Almost all affiliated charters are located in the two most wealthy Districts, as measured through a surrogate measure of poverty, the ‘school concentration of students eligible for free/reduced price meals’ (FRPM). BD2 (East LA) and BD5 (NE/SE LA) have the highest proportion of Hispanic students; BD7 (Central/South) ranks fourth in Hispanic students, behind BD6 (East Valley).
Whose Districts
Focusing specifically on the “Regular” and “Alternative” K-12 schools, whether charter or District-managed, shows the predominance of Hispanic students among the LAUSD-area K-12 grades.
Hispanic students outnumber all other ethnicities in every BD

There are three times as many Hispanic students among LAUSD traditional and District schools as all other ethnicities combined.
Ethnic distribution within Board Districts
Demographic-distribution-by-BDYet despite small numbers among other ethnicities, isolated groups do cluster noticeably within Districts. White and Asian students are disproportionately represented in BD3 (West Valley) and BD4 (West/Hollywood-SM Mtns). African-American students comprise twice as much of BD1 (West/South-Central) as each of BD7 (Central/South) and BD4.
Comparison of ethnic distribution within and between Board Districts.

Who’s Authorized?
Enrollment has declined on average 4% across the District from 2016-17 to 2018-19. Every Board District registered a decline overall, with the smallest of 1% in DB4 where total enrollment is lowest and average school poverty (measured surrogately) is lowest (see below).
ABSOLUTE enrollment figures for District and charter schools

District schools declined in all but BD3 (West Valley) where an increase in District schools of less than 1% is attributable to reversion of three affiliated charters – Calahan, Darby and Granada ES – to District status.
The decrease in District enrollment is greater than the decrease in charter enrollment. To distinguish District from charter schools visually, the dark green of District schools contrast with the lighter-hued charter schools; affiliated charters shaded in a light green color reflect their ambiguous charter status, separate in some ways yet also allied with the District through subordinate fiscal management.
PERCENTAGE enrollment for District and charter schools.

In every Board District independent charters comprise an increasing proportion of the District’s enrollment despite its overall decline. The wealthier BD3 and BD4 support only a modest majority of students in District schools. Affiliated charters comprise the semantic difference between describing “charters” to constitute a “quarter” or a “half” the Board District’s schools.
Whose Charters
An “unduplicated” count of students (UPC) who are either English Language Learners, Foster or Homeless Youth or students eligible for free or reduced-price meals (FRPM), is the metric used to calculate LAUSD’s entitlement from the State. Both are socioeconomic indicators of need. FRPM is a surrogate measure of poverty; UPC is more encompassing than the reductive FRPM count alone.
UPC data are not available for 2018-19. Because the annual decline in enrollment is significant it is important to retain a snapshot of the most recent year for comparison of demographics across Board Districts; FRPM is used. The more complete UPC poverty metric would be expected to yield a larger spread between districts were it available.
Free/Reduced-Meal eligibility concentration averaged for schools within each BD, 2018-19
FRPM-Distribution-among-BD-201819There are significant differences in average FRPM concentration between school types (specialized and unspecialized K-12 regular/charter/alternative schools), between BDs and also vast spread surrounding the averages (see boxplots below). The minimum and maximum as well as number of schools for each category are listed. On average the special education programs serve a slightly lower concentration of the disadvantaged than regular schools, and the at-risk programs a slightly higher. The average regular FRPM school concentration in BD4 (West/ Hollywood-SM Mtns) is less than 60% of the highest average in BD2 (East LA). Board districts 1, 3, 4 and 5 all have schools with FRPM concentration below 15%; the lowest among the rest is more than twice that. Poverty is concentrated geographically.
Fiscal management status differentiates charters from District schools and the populations they serve.
Average FRPM concentration among school types by BD
FRPM-avg-percent-by-BD-201819In BD4 the poverty concentration in affiliated charter schools is less than half that of the average district school; in BD3 it is slightly more than half. The populations these schools serve are fundamentally different. In BD1 and BD6 the distinction is far smaller and the direction between charter types ambiguous; an order of magnitude fewer affiliated charters is represented. Where there is a significant presence of affiliated charters, local independent charters too have lesser FRPM concentration (BD1, where there is just a solitary affiliated charter, is an exception). Where no or just one affiliated charter is present, independent charters have a higher average concentration of FRPM students.
Not just by average but by absolute number, there are far more schools of lower FRPM concentration in BD3 and BD4. Quintiles group equal numbers of schools showing the extended spread of schools with lower FRPM; their incidence is not just anomalous as in BD1 and BD5, but continuous. The schools in BD3 and BD4 are significantly less poor than elsewhere in the District.

The ethnic distribution across school types is discontinuous too. Affiliated charters serve seven times (7x) the proportion of White and Asian students (non Hispanic) compared with independent charters; five time (5x) the proportion of District schools. Hispanic students are underrepresented by more than 40%. And the average concentration of FRPM-eligible students is less than half that of District and independently managed charter schools.
percent-frpm-and-eth-by-fiscal-statusIndependent charters are more Hispanic and Black than District-managed schools, and underrepresented by over 30% of White and Asian (non Hispanic) students.

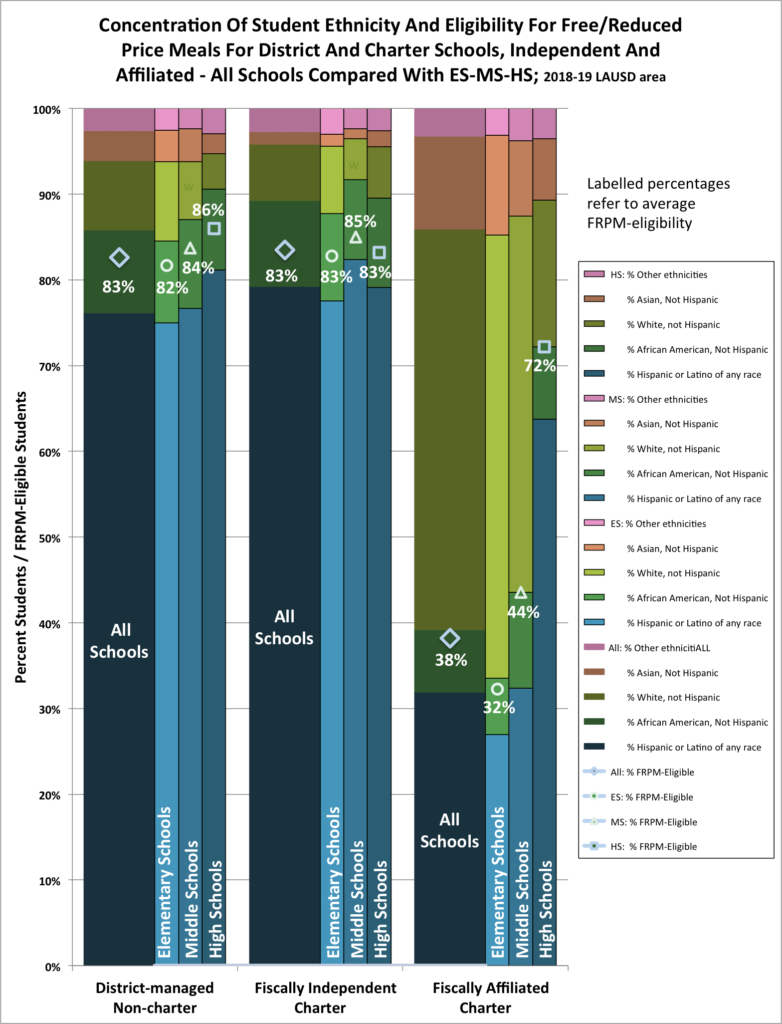
Average FRPM concentration in independent charters is slightly greater than in District schools (83.5% vs. 82.6%), but in affiliated charter schools the rate is less than half that of either independent charters or District schools (38.2% FRPM in affiliated charters is 46% of FRPM in District (82.6%) or independent charters (83.5%)).
The disparity is largest among types of Elementary schools (ES). In High School that gap (50% in ES) has shrunk by 80%. The proportion of White and Asian students lessens steadily from Middle to High School particularly in affiliated charters. One exception to the pattern is in independent charters where the proportion of White and Asian students increases slightly from Middle to High School.
For the purposes of tracking characteristic school populations, SPAN schools including grades from more than one type of school (i.e., elementary, middle or high) are categorized according to their lowest grade.
Ethnic and FRPM-Eligibility proportions according to District and charter school type
Eth-and-frpm-by-school-typeThe socioeconomic status and ethnic distribution of students in affiliated charters is very different from that in independent charter schools or District schools. While independent charters and District schools also differ the distinction is small. Nevertheless because common measures of Educational outcome and performance correlate highly with these socioeconomic variables, such underlying differences among school types matters importantly.

Carving out space for different subpopulations of a whole has serious ramifications on the nature of the whole. And the concept of separate but equal was ruled practically infeasible generations ago. Charter schools force a change in demographics among regular District schools, and affiliated charters in particular circumscribe a fundamentally different community. Mitigating the concentration of poverty and increasing diversity are important goals; protecting or advancing spaces of disproportionality cannot serve the goal of educating the public in common.